
Introduction
Using Point-in-Time (PIT)1 Count and Housing Inventory Count (HIC)2 data collected in early 2026, this initial release provides a snapshot of homelessness in King County and the shelter and housing resources available across the region.
The PIT Count estimates the number of people experiencing homelessness on a given night. Since 2022, KCRHA has used Respondent Driven Sampling for the unsheltered count, in partnership with the University of Washington, to support a more reliable and ethical estimate.3 The HIC catalogs available shelter and housing inventory on a single night.
This initial release highlights key findings from the 2026 PIT Count and HIC. A comprehensive report with additional analysis will be published later this year.
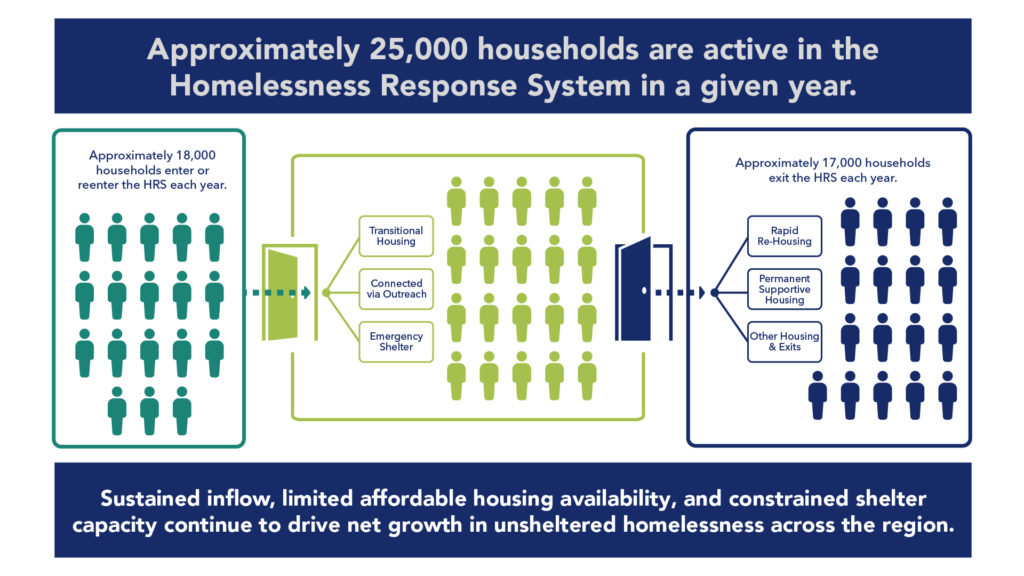
These findings should also be understood alongside broader system flow trends: the homelessness response system helps many people exit homelessness each year, but continued inflow, limited shelter capacity, and constrained affordable housing supply mean more people enter the system than exit.
The goal is to provide the community with an early view of homelessness trends, demographics, and system resources. Broader drivers of homelessness, length
of homelessness, and program performance are outside the scope of this document. Program performance information is available on KCRHA’s System Performance Dashboard.
Point-in-Time Count 2026
What is the extent of homelessness in King County?
The 2026 Point-in-Time Count shows that homelessness in King County continued to increase, though at a slower rate than in prior years. Between 2022 and 2024, the overall number of people experiencing homelessness increased by 26%. Between 2024 and 2026, that rate of increase slowed to 9%, suggesting some stabilization in the growth trajectory even as overall need continues to rise.
The graph below shows the total number of individuals experiencing sheltered and unsheltered homelessness (or overall homelessness). It also shows the proportion and number of people experiencing unsheltered and sheltered homelessness since 2022, when both unsheltered and sheltered PIT counts were completed.
Comparison of Overall Homelessness by Individuals
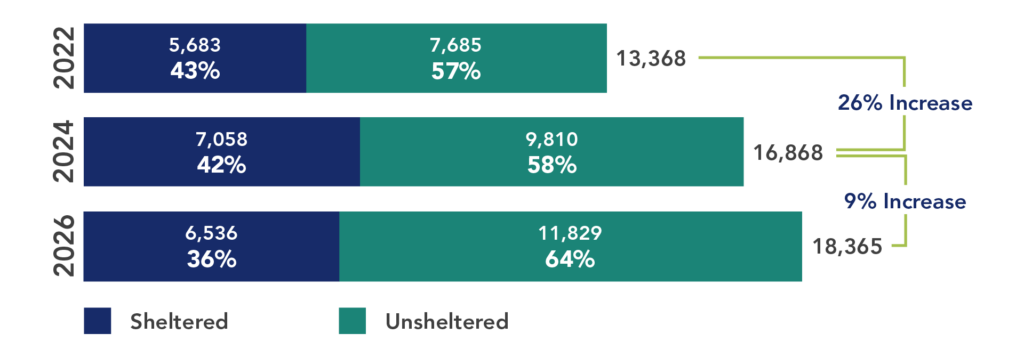
While overall shelter capacity has remained relatively static in recent years, the continued growth in homelessness—combined with limited expansion in shelter and housing resources—has contributed to an increase in the number of people experiencing unsheltered homelessness.
Homelessness Response System (HRS) Flow
The PIT Count also reflects a broader system flow reality. Each year, the homelessness response system helps thousands of households successfully exit homelessness through shelter, diversion, rapid re-housing, permanent supportive housing, and other interventions. Many programs across King County continue to produce strong housing and stabilization outcomes, demonstrating that the system is working for many people once they are connected to the right intervention. However, more households continue to be displaced into homelessness annually than the current system can provide long-term solutions for.
Race & Ethnicity
Homelessness continues to disproportionately affect communities of color in King County. It is important to recognize that homelessness is an outcome of structural racism and racial inequities.
We continue to see over-representation of individuals who identity as: Hispanic/Latina/e/o, Black/African American/African, Multi-Racial, Native Hawaiian or Other Pacific Islander, and American Indian/Alaska Native/Indigenous experiencing homelessness compared to census-based population estimates in King County.4
Race and Ethnicity by Proportion and Shelter Status, 2026
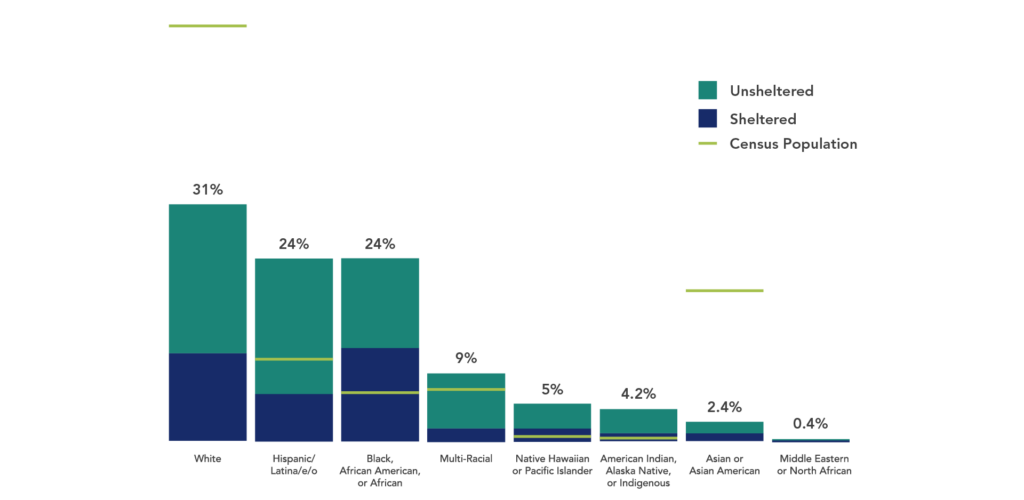
Note: For 2026, we have adjusted our methodology for reporting race and ethnicity, particularly with respect to those who identify as Multi-Racial and Hispanic/Latina/o; additional details will be provided in our comprehensive report.
King County Census Population share: 54.4% white, 10.8% Hispanic/Latina/e/o, 6.4% Black, African American or African, 6.9% Multi-Racial, 0.7% Native Hawaiian or Pacific Islander, 0.4% American Indian, Alaska Native, or Indigenous, 19.7% Asian or Asian American, American Community Survey Census Reference (2025) is not available for Middle Eastern or North African
Family Homelessness
Homelessness interventions are often organized by household type and age, including households with minor children. The charts below show both the estimated number of people in households with minor children, and the estimated number of family households that were homeless on the night of the count, either unsheltered or sheltered.
The estimated number of families experiencing homelessness remains elevated, going from 1,428 in 2024 to 1,370 in 2026.5 Unsheltered family homelessness has increased since 2022—from 1,253 individuals in 415 households to 2,224 individuals in 647 households in 2026.
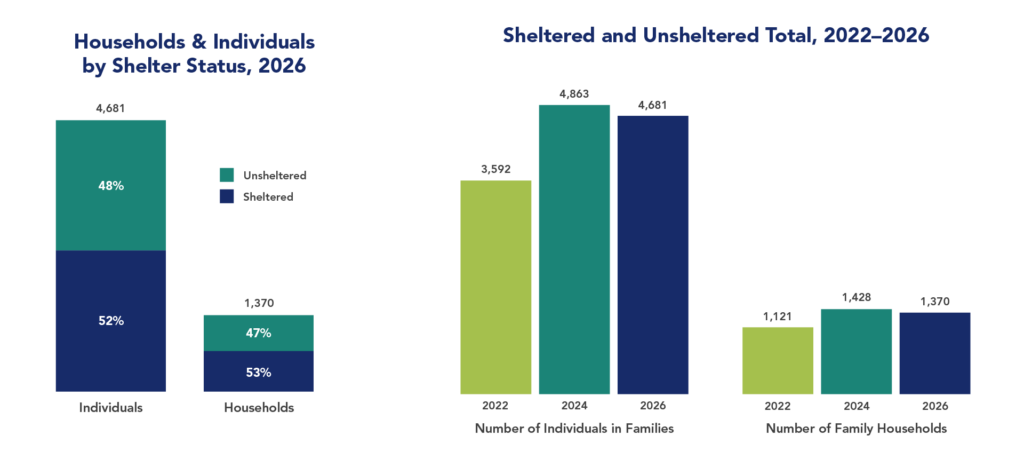
Between 2025 and 2026, shelter beds decreased from 5,958 to 5,269, a reduction of 689 resources. This decline was driven in significant part by losses in household and family shelter capacity. Even with this reduction, individuals in families are more likely to be sheltered than the overall population: 52% are sheltered compared to 36% of all individuals experiencing homelessness.
Additional Vulnerabilities & Communities
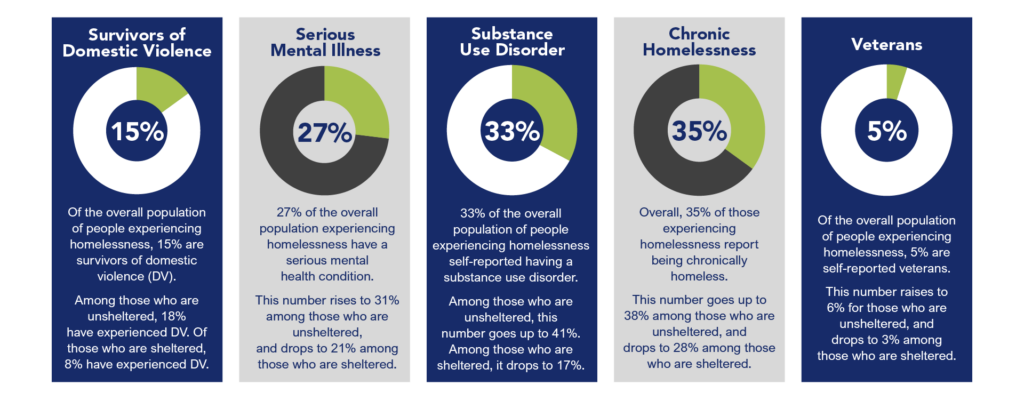
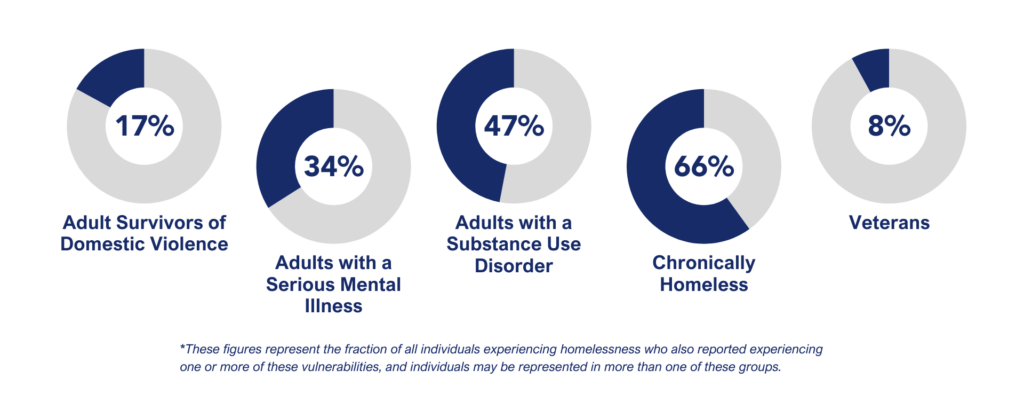
Experiencing homelessness is traumatic and can trigger, create, or exacerbate health conditions, disability, substance use disorder, and mental and behavioral health conditions. At the same time, homelessness can make it harder to access treatment and care.
Individuals self-reported their vulnerabilities, and may be represented in more than one group. This analysis includes the overall proportion of the population experiencing a particular vulnerability and the breakdown by shelter status.
The graphics below show the estimated proportions of individuals6 in the 2026 PIT Count who self-reported the following vulnerabilities by unsheltered individuals (11,829), sheltered individuals (6,536), and overall individuals (18,365).
Housing Inventory Count 2026
What Resources Exist in the Homelessness Response System?
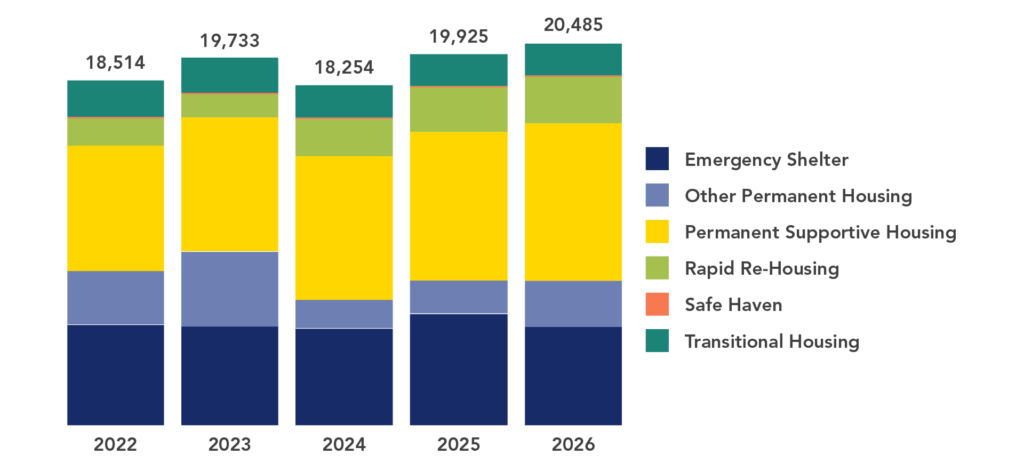
The Homelessness Response System (HRS) includes shelter and housing resources operated by community providers throughout King County. These resources are measured annually through the Housing Inventory Count (HIC), which provides a snapshot of available shelter and housing capacity across the region.
Overall, HRS inventory has grown in recent years, particularly permanent housing resources, including Permanent Supportive Housing (PSH), Rapid Re-Housing (RRH), and Other Permanent Housing (OPH). However, emergency shelter capacity has remained relatively flat while homelessness has continued to increase. Shelter and emergency resources include Transitional Housing (TH), Emergency Shelter (ES), and Safe Haven (SH).
Even with growth in housing inventory, demand continues to outpace available resources. Occupancy remained high at 94% on the night of the count, indicating that most shelter and housing programs were operating near capacity. While overall inventory has expanded over time, particularly in permanent housing, available resources remain insufficient to meet current levels of need.
Shelter and HRS Housing Resources, 2022–2026
Shelter and Emergency Resources
When comparing emergency shelter resources to the number of people who may need shelter, King County currently has approximately one shelter bed for every three people experiencing homelessness. In addition, shelter utilization was over 93% on the night of the HIC, indicating that available beds were operating near capacity.
Emergency Shelter Beds Over Time7
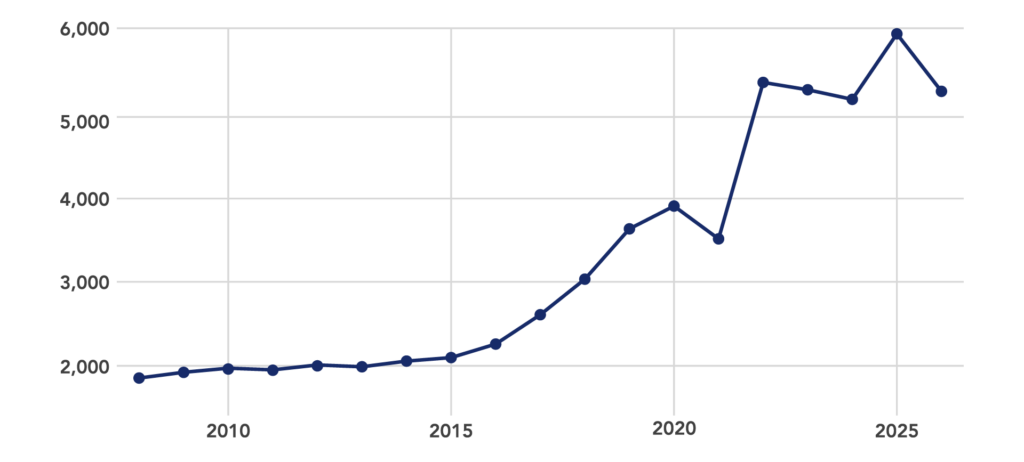
The community continues to respond to the need. In 2025, there were 1,609 privately funded emergency shelter and transitional housing beds (21% of the system) and in 2026 it was 1,413 beds or 20% of all emergency shelter and transitional beds. These privately funded beds reflect the important role of community-based and non-governmental partners, but they are not sufficient to meet the scale of need without additional public investment. Dedicated efforts are underway to increase the number of shelter beds available in Seattle8, 9 and King County.10
Shelter and HRS Housing Resources Over Time11
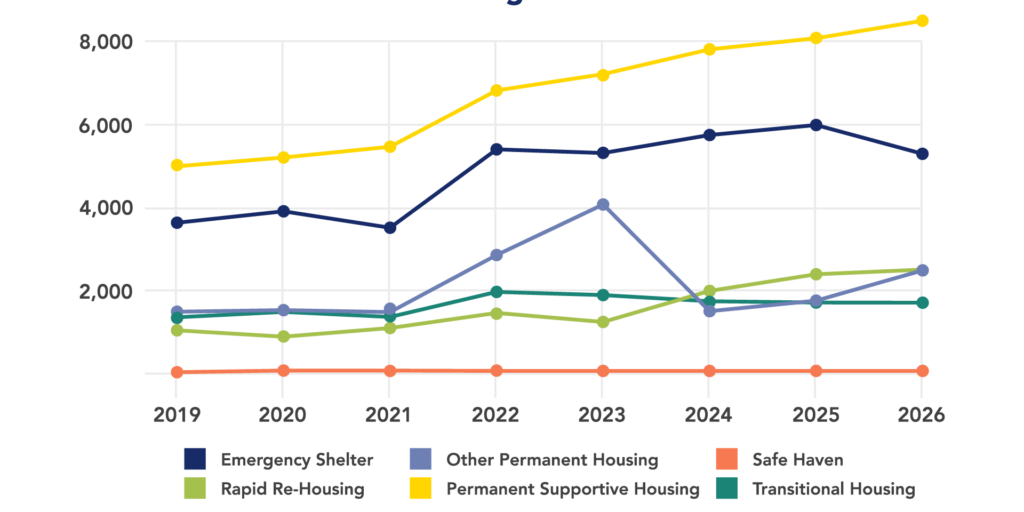
Opening housing programs for those most affected by homelessness is essential. The graph above showcases the growth of housing programs compared to shelter and other emergency resources.
In 2026, the community plans on opening 155 units of Permanent Supportive Housing (PSH) for single adults and families. That’s in addition to the 561 PSH units that opened in 2025.
Next Steps & Acknowledgements
Stay updated by subscribing to KCRHA emails, or follow us on social media on these platforms: Facebook, LinkedIn, Instagram, and Threads. Stay tuned for the comprehensive report later this year.
We are deeply grateful to the thousands of people who participated in the 2026 Point-in-Time count survey for sharing their time, experiences, and perspectives. Their contributions help our region better understand homelessness and the supports needed to move more people toward safety, stability, and housing. We also thank the interviewers, service providers, host cities, community partners, and KCRHA staff whose work made the 2026 Point-in-Time Count possible. We appreciate you.
2026 King County Point-in-Time Count & Housing Inventory Count Executive Report – downloadable PDF – published June 23, 2026
2026 Point-in-Time Count & Housing Inventory Count Frequently Asked Questions – downloadable PDF – published June 23, 2026
The full, comprehensive report and additional analysis will be published in the coming months.
How many people were housed in 2025?
In 2025, our homelessness response system housed or helped maintain housing for more than 10,000 households. This is the fourth straight year that housing outcomes have increased.
What is the Point-in-Time Count?
The Point-In-Time (PIT) count is a one-night estimate of both sheltered and unsheltered populations experiencing homelessness. The U.S. Department of Housing and Urban Development (HUD) requires the PIT count to be conducted every two years to receive federal funding, with cities and counties nationwide conduct the count during the last week of January. The PIT Count is the single largest and most comprehensive look at unsheltered homelessness in King County, and will be used to inform policy, planning, resource allocation, and further research.
How did KCRHA collect the data for the Point-in-Time and Housing Inventory Count (HIC)?
The KCRHA received approval from HUD to conduct the 2026 unsheltered count using a methodology called Respondent Driven Sampling (RDS). This methodology, consistent with the 2022 and 2024 PIT Count, has a proven track record for reaching people who are not already connected to services. It provides a valuable data point that supplements client data in the Homeless Management Information System (HMIS) and other systems.
The count took place from January 26 to February 6. KCRHA staff and more than 200 volunteers conducted interviews at 25 hub sites in urban and suburban, as well as rural & unincorporated areas of King County through mobile sites. People experiencing homelessness answered questions about their living situation and health and provided demographic information. Each person referred others in their network to a hub site for the same process. KCRHA worked with an expert statistician at the University of Washington to advise on sampling design and statistical modeling. We pulled the sheltered count from the Homeless Management Information System (HMIS) data on Jan 29, 2026.
What is the Housing Inventory Count?
The Housing Inventory Count (HIC) is a point-in-time inventory of provider programs within a Continuum of Care (CoC) that provide beds and units dedicated to serve people experiencing homelessness, categorized by five Program Types: Emergency Shelter, Transitional Housing, Rapid Re-Housing, Safe Haven, and Permanent Supportive Housing.
For the 2026 Housing Inventory Count, KCRHA pulled data from the Homeless Management Information System Data on January 29, 2026. Sharing this information alongside the PIT Count data is vital in understanding the homeless response system capacity, what resources exist in our system, and their efficacy.
What is Respondent Driven Sampling (RDS)?
Unlike traditional street counts, RDS reaches people through trusted social networks and can identify individuals who may not be visible during a one-night observational count. RDS relies on peer-to-peer recruitment, using a coupon system to reach the community. KCRHA distributed the initial round of coupons, known as “seeds” to selected organizations that do outreach to people experiencing homelessness. Outreach volunteers and staff distributed the seed coupons to unsheltered community members in encampments around King County.
Once an individual or household has a voucher, they can go to one of many PIT Count Hub Sites, take a survey, receive a gift card for their time, and take three coupons to distribute within their networks. This creates a referral chain, allowing us to reach deeper into the unsheltered community, leading to more accurate, robust, and representative data collection.
RDS is not a census, but a rigorous data sample that, when used in conjunction with data in the Homeless Management Information System (HMIS), allows us to derive high quality estimates. RDS is a humanizing research process—it invites individual connection and collection of data on lived experiences, while holding to the high standards of academic researchers.
Why does KCRHA use the RDS model, and how does it differ from other PIT Count models?
Prior to 2022, the PIT Count was done on a single night — sometimes referred to as a “one night count” — with volunteers going out to look for people living unsheltered and counting them. Although this method galvanized community engagement, it produced an undercount and wasn’t able to produce the level of detail needed to address the complexities of people’s experiences.
When KCRHA took over the administration of the PIT Count in 2022, KCRHA shifted to a different methodology: Respondent Driven Sampling (RDS). RDS has been endorsed by numerous studies by academic researchers, confirming its effectiveness in producing high-quality demographic and population estimates. Having completed PIT Counts in 2022 and 2024, this will be KCRHA’s third count using RDS.
What’s the difference between sheltered and unsheltered homelessness? Why is it important to differentiate them?
Sheltered homelessness refers to people who are staying in emergency shelters, transitional housing programs, or safe havens. Unsheltered homelessness refers to people whose primary nighttime location is a public or private place not designated for or ordinarily used as a regular sleeping accommodation such as vehicles, parks, or the street. Because the PIT Count is used to allocate funding to specific programs and services, distinguishing between sheltered and unsheltered is essential.
How did the 2026 numbers change compared to 2024?
The number of people experiencing homelessness overall in King County is 9% higher than our 2024 report. Comparatively, between 2022 and 2024, the overall number of people experiencing homelessness increased by 26%. KCRHA conducts the unsheltered count every two years. Here’s a breakdown of the numbers:
| Year | Sheltered | Unsheltered | Total |
| 2022 | 5,683 | 7,685 | 13,368 |
| 2024 | 7,058 | 9,810 | 16,868 |
| 2026 | 6,536 | 11,829 | 18,365 |
Why is homelessness increasing?
Research consistently shows that homelessness is closely linked to housing affordability and housing availability. Communities with high housing costs and limited affordable housing often experience significantly higher rates of homelessness, regardless of poverty rates alone. As University of Washington researcher Gregg Colburn has noted, Seattle has fewer people living in poverty than Detroit on a per-capita basis, yet significantly higher rates of homelessness because the consequences of poverty are far more severe in housing markets where rents are high and vacancies are scarce.
Homelessness is not a static population. Each year, thousands of people enter homelessness, and thousands of people exit homelessness through shelter, housing, and other interventions. The challenge facing King County is not simply helping people leave homelessness; it is that new inflow into homelessness continues to outpace exits. As a result, homelessness can continue to increase even while many people successfully move toward housing and stability.
Other contributing factors include:
- Shelter capacity remained largely static, with a decline in emergency shelter beds, specifically those serving families. This change in inventory impacted the sheltered count.
- There’s one shelter bed for every three individuals that need one in King County, meaning the system is overburdened. The needs of people experiencing homelessness outweigh what’s available, and housing resources are insufficient to meet the region’s needs.
- KCRHA expanded the number of hub sites and added sites in locations recommended by community feedback, leading to more completed surveys and more accurate number of our homelessness population.
Why did the sheltered count decrease?
Between 2024 and 2026, shelter beds decreased from 5,958 to 5,269, a reduction of 689 resources. This decline was driven in significant part by losses in household and family shelter capacity. Several factors contributed to the reduction in family shelter beds, including loss of shelter buildings and difficulty finding suitable replacement sites that meet the complex needs of families. Families experiencing homelessness have a range of unique supports like childcare, school access, and larger, private space for children, which require a fundamentally different shelter model than the system has historically provided for individuals. The PIT Count highlights that more emergency shelter is needed in our area that serves families with dignity and care for the whole family unit.
Why did homelessness increase by 9% if we spend so much money on homelessness services?
The PIT Count measures the total number of people experiencing homelessness on a single night. It does not measure how many people received services, entered shelter, moved into housing, or exited homelessness over the course of a year. Thousands of people move through the Homelessness Response System annually, but continued inflow into homelessness remains slightly higher than the number of people exiting. The result is that homelessness can continue to increase even while many people receive assistance and achieve housing stability.
Why are vulnerable communities highlighted?
Different subpopulations experiencing homelessness require different types of support and resources as we seek to connect them with shelter and housing opportunities. By understanding what proportion of the overall population experiencing homelessness are experiencing certain vulnerabilities, it can help us shape the Homelessness Response System (HRS) to respond to those vulnerabilities in the correct proportions.
It is important for service providers, funders, and others in the homelessness response system to understand the breadth of services needed to provide trauma-informed, person-centered care, particularly as it is more difficult for those experiencing homelessness to access services. Because of the historical stigma around these conditions and identities, numbers have historically been underreported, leading to increased potential for underfunding necessary programs and services.
How do we know that homelessness is an outcome of structural racism and inequities?
In the PIT Count, we compare U.S. Census data to compare population estimates in King County and helps us recognize when certain groups are disproportionately impacted. Homelessness is a housing problem, and systemic trends of racial discrimination in areas like housing and economic advancement contribute to the overrepresentation of the following communities: Hispanic/Latina/e/o, Black/African American/African, Multi-Racial, Native Hawaiian or Other Pacific Islander, and American Indian/Alaska Native/Indigenous.
Were there substantial shifts in the demographics of people experiencing homelessness?
The initial findings show a substantial increase in the share of respondents identifying as White. Additional analysis will be required to determine whether this reflects methodological changes, Census reporting changes, demographic shifts, or other factors.
Our more detailed report, which will be released later this year, will examine whether that change is a result of the following:
- The methodology for conducting the count.
- The impact of a change in how the Census Bureau dictates how we collect (PDF) racial and ethnic identity.
- A fundamental shift in who is experiencing homelessness in King County.
- Or some other factor.
What does the Homelessness Response System Flow graphic tell us about homelessness in King County?
The Homelessness Response System (HRS) Flow graphic is intended to illustrate the movement of people through the Homelessness Response System over time. It is not a precise accounting of every housing outcome or every individual trajectory. Some people successfully exit homelessness and remain stably housed; some require additional assistance later, and some return to homelessness after a period of stability. The broader takeaway is that homelessness is a dynamic system with substantial movement both into and out of services each year.
What is KCRHA’s role in addressing homelessness?
KCRHA is an administrative agency that distributes approximately $205 million annually to more than 60 service providers that provide services such as emergency shelter, day centers, and transitional housing. KCRHA manages a regional data system, operates Coordinated Entry, manages the Homeless Management Information System (HMIS), and has an Ombuds Office.
Factors that contribute to why someone becomes homeless are outside the scope of KCRHA. The agency also does not build affordable housing.
What additional information can be expected in the full 2026 Point-in-Time Count findings that is not shown in this initial report?
In the longer, in-depth 2026 PIT Count report, community members can expect to see:
- More in-depth explanation of scope, sources, and methodology,
- Additional analysis of communities impacted by homelessness,
- Break out information on people experiencing homelessness in individual subregions of King County,
- Demographic results by racial/ethnic identities, gender identity, age, and household composition,
- Summary findings,
- And Appendices including documents used during the Count.
- The Point in Time (PIT) Count is required by Housing and Urban Development (HUD) every year for shelter data and every other year for both shelter and unsheltered data. Sheltered data is collected on January 29, 2026 from the Homeless Management Information System (HMIS) and provider surveys.
- The Housing Inventory Count (HIC) is required by Housing and Urban Development (HUD) collected using the Homeless Management Information System collected on January 29, 2026 and provider surveys.
- For 2026, 2024, 2022 the unsheltered portion was led by the University of Washington using Respondent Driven Sampling (RDS) methodology was used for data collection and generation of the estimates. In 2026 we surveyed at nearly 30 different locations with over 150 community volunteers.
- U.S. Census Bureau. (2024). American Community Survey 5-Year Estimates, Table DPO5: Total Population. Retrieved from data.census.gov.
- These figures represent the total of households with at least one adult and one child. Households are defined as cohabitating groups.
- Totals includes individuals either in shelter or unsheltered age 18 or over who self-reported.
- Increased number of shelter beds from 2021 to 2022 due to several factors notable the inclusion of Tiny Home Villages in the HIC report for the first time as well as increase of federal resources due to COVID-19 response.
- Seattle Times. (May 6, 2026). Seattle City Council moves to expand homeless shelter site sizes. https://www.seattletimes.com/seattle-news/homeless/seattle-city-council-moves-to-expand-homeless-shelter-site-sizes/
- Seattle Times. (April 16, 2026). Seattle council approves bills to speed up shelter construction. https://www.seattletimes.com/seattle-news/homeless/seattle-council-approves-bills-to-speed-up-shelter-construction/
- Breaking the Cycle King County Executive Order No:ACO-8-34-EO. March 31, 2026. https://content.govdelivery.com/attachments/WAKING/2026/03/31/file_attachments/3602521/Breaking%20the%20Cycle%20Executive%20Order%20Final.pdf
- Federal Permanent Housing voucher resources (included in the “Other Permanent Housing” category) increased during 2021 to 2024 due to COVID-19 response.
Download the 2024 Unsheltered PIT Count Methodology Info Sheet
Watch a video with details on the methodology
View a letter from University of Washington researchers about the methodology
Journal Article: Innovating a Community-driven Enumeration and Needs Assessment of People Experiencing Homelessness
What We Did
Prior to 2022, the unsheltered PIT was conducted by volunteers one night in January, using a census and survey. The PIT is widely understood to be an undercount, especially as it represents a single night rather than a full year.
The KCRHA received approval from HUD to conduct the 2024 unsheltered count using a methodology called Respondent Driven Sampling (RDS). This methodology is consistent with the 2022 PIT Count. RDS has been shown to be effective in reaching people who are not already connected to services, providing a data point that supplements client data in the Homeless Management Information System (HMIS) and other systems. This methodology has a strong track record for producing high-quality demographic and population estimates, confirmed by numerous studies by academic researchers and the World Health Organization.
KCRHA is working with researchers at the University of Washington and people with lived experience of homelessness to ensure validity in design, data collection, and analysis. We will work with these researchers to have the final methodology approved by an Institutional Review Board (IRB) and results will be peer reviewed for publication. Data will be collected using a digital survey and will not include qualitative interviews like the 2022 count.
For the 2024 unsheltered PIT, KCRHA gathered data from January 22 – February 2, 2024, and then worked with an expert statistician at the University of Washington to advise on sampling design and statistical modeling. The sheltered count was pulled from the Homelessness Management Information system (HMIS) data on January 25, 2024.
How This Works
- Start interviews at places like encampments and day centers across King County
- Ask people who were interviewed to connect us with other people who could be interviewed too
- People can then be interviewed at “hubs” hosted at places like libraries
- Those people are asked to connect us with more people they know
- Interviewees were compensated for their time with a $25 prepaid debit card and provided bus tickets to and from hubs.
- In addition to completing an interview, participants complete a demographic and network survey
- Our Research and Analytics Team used these surveys to produce population estimates for the unsheltered PIT
Point-in-Time Count 2024
The Unsheltered Point-in-Time (PIT) Count is required every other year by the U.S. Department of Housing and Urban Development (HUD) to effectively allocate federal funds to support regional efforts to end homelessness. It is widely understood to be an undercount.
KCRHA conducted both an unsheltered and sheltered PIT Count in January 2024, along with the required Housing Inventory Count (HIC) of emergency shelter beds and certain types of housing units.
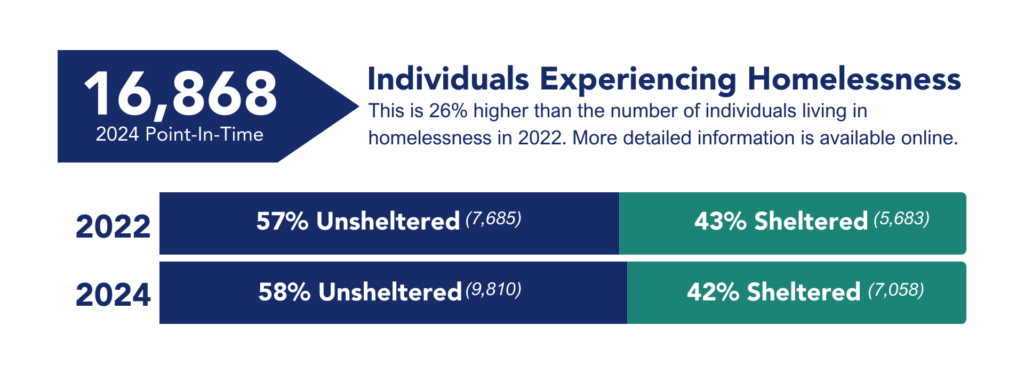
The 2024 PIT count found that on any given night in King County, there are an estimated 16,868 individuals experiencing homelessness. This is 26% higher than the 2022 PIT estimate, which when adjusted for population growth during the same period, represents an increase of about 1.4 people per thousand people.
Racial Inequity
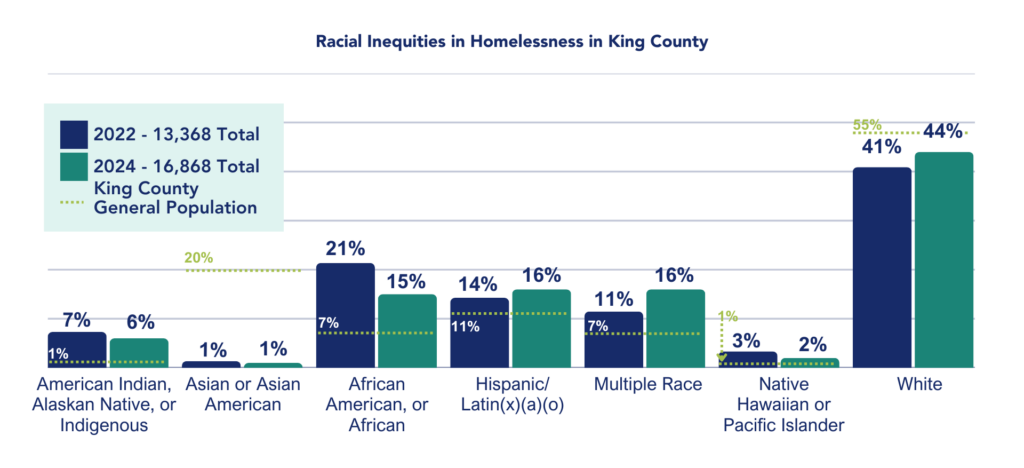
Homelessness continues to disproportionately affect communities of color in King County. Based on the PIT analyses, 15% of people experiencing homelessness in King County identify as Black/African American, but according to 2023 U.S. Census data only 7% of King County’s population identifies as Black/African American. Similarly, 6% of people experiencing homelessness identify as American Indian, Alaskan Native, or Indigenous, but that group makes up less than 1% of King County’s population.
As our community continues the dialogue about race and equity, it is important to recognize that homelessness is an outcome of structural racism and racial inequities.
Family & Youth Homelessness
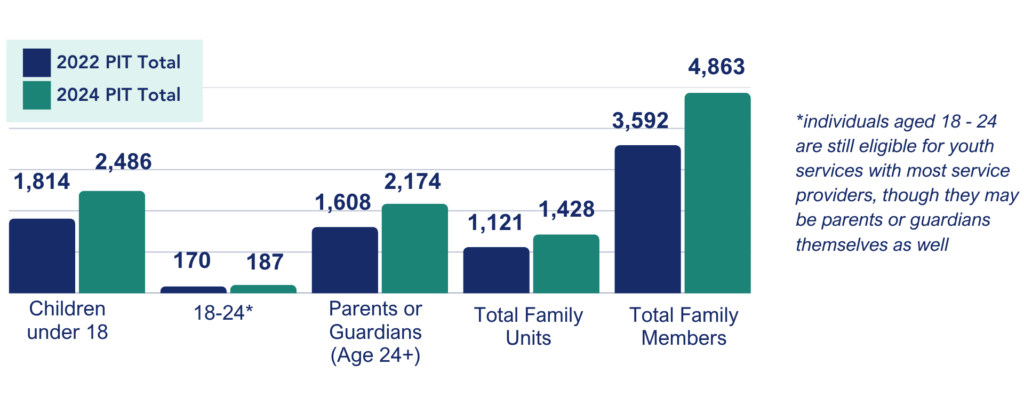
Homelessness interventions are often characterized by household type (single vs. family) and age (unaccompanied minor, youth, adult, etc.). We know that homelessness can have long-term negative effects on families, especially on children and youth when the prolonged and generational impacts from exposure to trauma, lack of consistent education and adequate nutrition, and lack of a sense of safety are considered.
Gender Identities
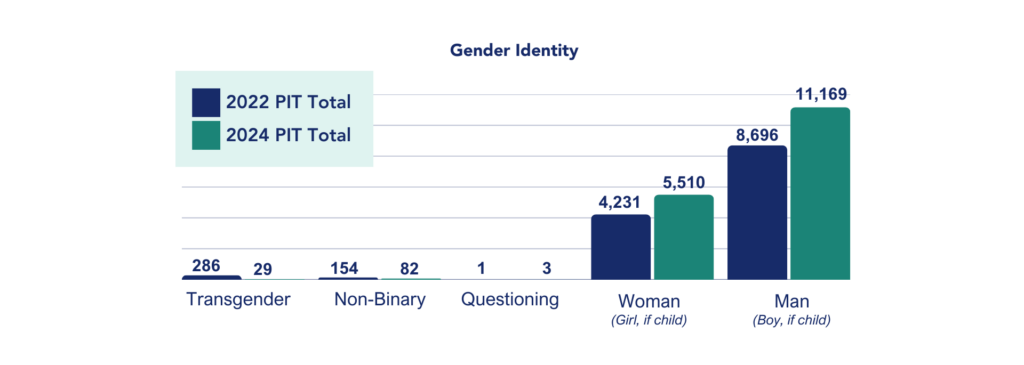
As our collective understanding of the fluidity and breadth of gender identification grows, we strive to serve marginalized groups whose physical, emotional, and psychological needs have been historically ignored. Much of this effort involves providing location-based services accessible to all, and especially to those communities each program is designed to serve.
Additional Vulnerabilities & Communities (Unsheltered Only)
Experiencing homelessness is traumatic and can trigger, create, or exacerbate health conditions, disability, substance use, and mental and behavioral health conditions, while at the same time making it harder to access treatment and care. We asked survey respondents to identify if they are experiencing one or more of these vulnerabilities.
For Veterans who experience homelessness, many of the same complications apply, and are often compounded by profound physical disability, PTSD, and the substantial challenge of reintegrating into civilian society. While not all Veterans represent a vulnerable group, the experience is varied, and the needs for recovery are often complex.
Navigating the health care system is difficult, and it’s harder for people who are regularly displaced to schedule and keep traditional appointments.
We owe our thanks to our thousands of neighbors living in homelessness who offered us their time and their stories to make the ongoing work to find equitable housing for all possible. Thank you to our partners who served as interviewers. We also appreciate the cities that hosted interview locations, all the partners who made this possible, and the KCRHA staff who lead this project. We appreciate you.
KCRHA 2024 Point-in-Time Count Comprehensive Report – corrected March 2026 for technical error
KCRHA Point-in-Time Count Summary of Key Findings & FAQ
2024 PIT One-Pager – updated May 2026
2024 PIT Count FAQs – updated April 2025
KCRHA 2024 PIT Comprehensive Report Deep Dive – recording of September 26, 2025 webinar
What is the Point-in-Time Count?
The Point-In-Time (PIT) count is a one-night estimate of both sheltered and unsheltered populations experiencing homelessness. Cities and counties nationwide conduct the count during the last week of January. The Department of Housing and Urban Development (HUD) requires the PIT count to be conducted every two years to receive federal funding.
How does this data compare to other estimates of homelessness in King County?
The Point-in-Time Count seeks to estimate the number of people who experience homelessness on a single night of the year. Over an entire year, KCRHA serves substantially more people, and the PIT count is broadly understood to be an undercount. As such, KCRHA also heavily relies on the Washington Department of Commerce’s estimate (derived from information in dozens of administrative databases ranging from unemployment insurance to Medicaid) that nearly 54,000 people experienced homelessness in King County over the course of a year.
How did you collect this information?
The KCRHA received approval from HUD to conduct the 2024 unsheltered count using a methodology called Respondent Driven Sampling (RDS). This methodology, consistent with the 2022 PIT Count, has a proven track record for reaching people who are not already connected to services. It provides a valuable data point that supplements client data in the Homeless Management Information System (HMIS) and other systems. RDS has been endorsed by numerous studies by academic researchers and the World Health Organization, confirming its effectiveness in producing high-quality demographic and population estimates.
The count took place from January 22 – February 2, 2024. KCRHA staff and more than 130 volunteers conducted interviews at 19 hub sites in urban, suburban, and rural parts of King County. People experiencing homelessness answered questions about their living situation and health and provided demographic information. Each person referred others in their network to a hub site for the same process. KCRHA worked with an expert statistician at the University of Washington to advise on sampling design and statistical modeling. We pulled the sheltered count from the Homelessness Management Information System (HMIS) data on January 25, 2024.
A video of Owen Kajfasz, KCRHA’s Chief Community Impact Officer, explaining the methodology is available on our YouTube channel.
How is RDS better than the traditional volunteer PIT Count?
The traditional unsheltered Point-In-Time count relied on volunteers to spread out across the county on one night in January and count the number of people that they physically see living unsheltered, multiplied by a number that’s meant to estimate the people they didn’t see (such as people in abandoned buildings). Because it relies on what volunteers see during a few hours in the early morning, in a neighborhood or area that may be unfamiliar to them, recorded on a paper tally sheet, at a time when there may be heavy rain or cold, there are many ways for data to be missed. Most people in the data science and homeless services sector agree that this traditional hand count results in an undercount, which may mask the full scale of the problem.
What’s the difference between sheltered and unsheltered?
Sheltered homelessness refers to people who are staying in emergency shelters, transitional housing programs, or safe havens. Unsheltered homelessness refers to people whose primary nighttime location is a public or private place not designated for or ordinarily used as a regular sleeping accommodation—for example, the streets, vehicles, or parks.
How did the 2024 numbers change compared to 2022?
The number of people experiencing homelessness overall in King County is 26% higher than our 2022 report. Here’s a breakdown.
| Year | Sheltered | Unsheltered | Total |
| 2022 | 5,683 | 7,685 | 13,368 |
| 2023 | 6,464 | N/A | |
| 2024 | 7,058 | 9,810 | 16,868 |
Youth and family homelessness is lower than in 2022 (see one-pager).
Why are the numbers higher?
This is a complex question. Homelessness is up across the country. We recommend reading the latest publication from the Federal Interagency Council on Homelessness to learn some key facts about homelessness in our country and some key strategies that are being applied in communities like King County.
Homelessness is a housing problem, and the lack of affordable options is impacting King County residents. A recent report from the Department of Commerce emphasized the lack of affordable housing options has reached critical levels: “Nearly half of the new homes required in the coming decades must be affordable to households earning less than 50% of area median family income. This shortage of affordable housing contributes to homelessness, housing instability, and increasing costs for low- and moderate-income families.” Also, while people are exiting homelessness, more people are entering homelessness.
KCRHA also expanded the number of hub sites and added sites in locations recommended by community feedback, leading to more completed surveys.
Were there substantial shifts in the demographics of people experiencing homelessness?
The results indicate a substantial increase in the share of people who report as White among people experiencing homelessness. Our more detailed report, which will be released this summer, will examine whether that change is a result of the following:
- The methodology for conducting the count.
- The impact of a change in how the Census Bureau dictates how we collect racial and ethnic identity.
- A fundamental shift in who is experiencing homelessness in King County.
- Or some other factor.
Were there changes in the number of people from groups or populations experiencing homelessness that are notable?
More detailed data and analysis will be released later.
How many people are experiencing homelessness in my area?
KCRHA will share a geographic breakdown of the count later.