
Point-in-Time Count 2024
The Unsheltered Point-in-Time (PIT) Count is required every other year by the U.S. Department of Housing and Urban Development (HUD) to effectively allocate federal funds to support regional efforts to end homelessness. It is widely understood to be an undercount.
KCRHA conducted both an unsheltered and sheltered PIT Count in January 2024, along with the required Housing Inventory Count (HIC) of emergency shelter beds and certain types of housing units.
Below you’ll find the preliminary reports from the 2024 PIT Count. We will continue to release more information, including the full HUD report, Housing Inventory Count, and subregional breakdowns, over the next several weeks.
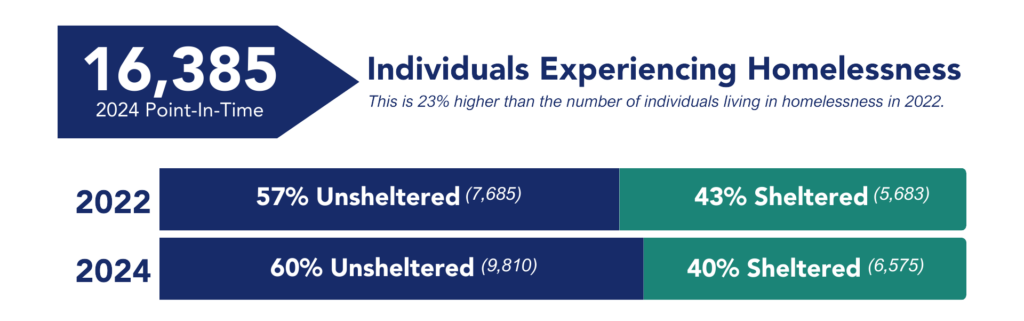
The 2024 PIT count found that on any given night in King County, there are an estimated 16,385 individuals experiencing homelessness. This is 23% higher than the 2022 PIT estimate, which when adjusted for population growth during the same period, represents a 12% increase over changes expected due to population increase.
Racial Inequity
Homelessness continues to disproportionality affect communities of color in King County. Based on the PIT analyses, 19% of people experiencing homelessness in King County identify as Black/African American, but according to the 2020 U.S. Census only 6% of King County’s population identifies as Black/African American. Similarly, 7% of people experiencing homelessness identify as American Indian, Alaskan Native, or Indigenous, but that group makes up only 1% of King County’s population.
As our community continues the dialogue about race and equity, it is important to recognize that homelessness is an outcome of structural racism and racial inequities.
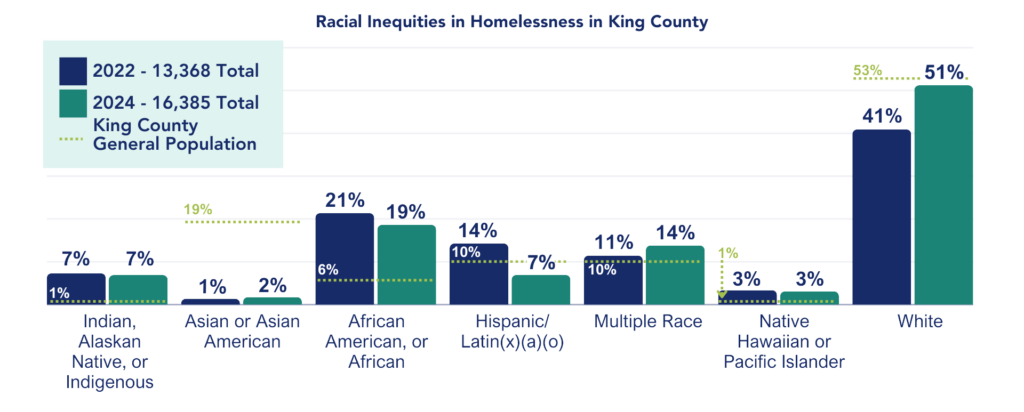
The results indicate a substantial increase in the share of people who report as White among people experiencing homelessness. Our more detailed report, which will be released this summer, will examine whether that change is a result of the following: the methodology for conducting the count, the impact of a change in how the Census Bureau dictates how we collect racial and ethnic identity, a real change in who is experiencing homelessness in King County, or some other factor.
Family & Youth Homelessness
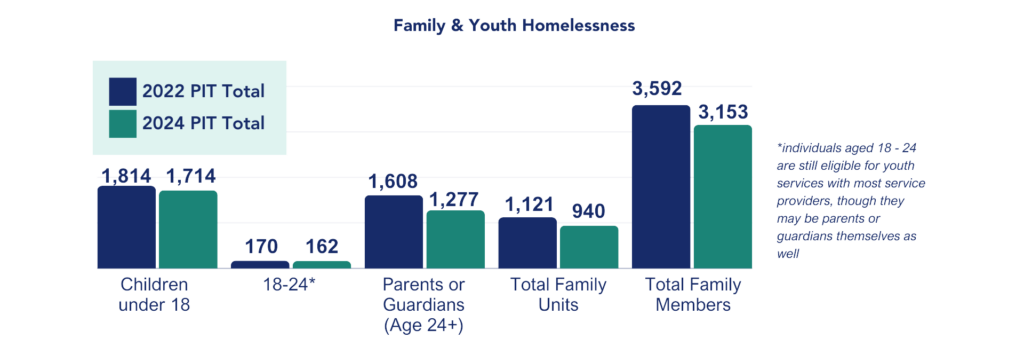
Homelessness interventions are often characterized by household type (single vs. family) and age (unaccompanied minor, youth, adult, etc.). We know that homelessness can have long-term negative effects on families, especially on children and youth when the prolonged and generational impacts from exposure to trauma, lack of consistent education and adequate nutrition, and lack of a sense of safety are considered.
Gender Identities
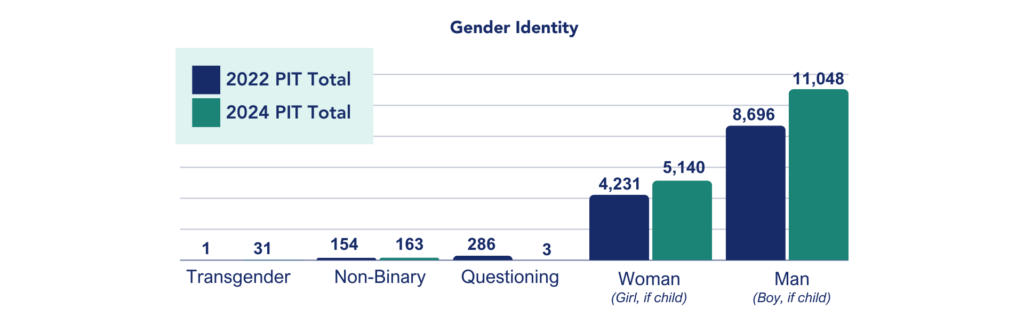
As our collective understanding of the fluidity and breadth of gender identification grows, we strive to serve marginalized groups whose physical, emotional, and psychological needs have been historically ignored. Much of this effort involves providing location-based services accessible to all, and especially to those communities each program is designed to serve.
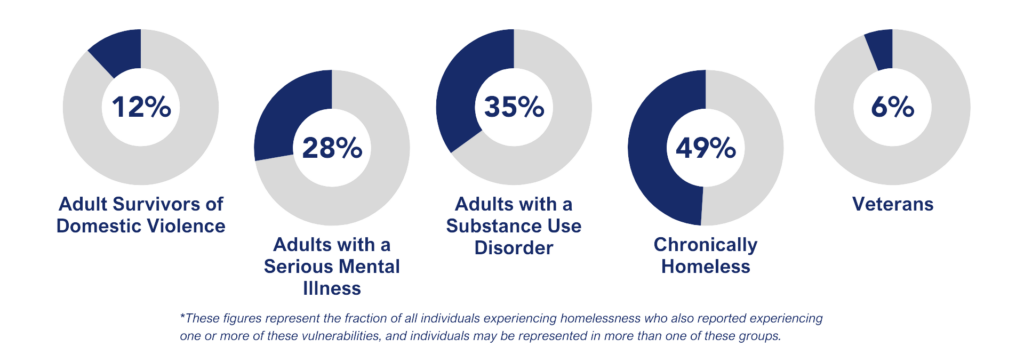
Additional Vulnerabilities & Communities
Experiencing homelessness is traumatic and can trigger, create, or exacerbate health conditions, disability, substance use, and mental and behavioral health conditions, while at the same time making it harder to access treatment and care. We asked survey respondents to identify if they are experiencing one or more of these vulnerabilities.
For Veterans who experience homelessness, many of the same complications apply, and are often compounded by profound physical disability, PTSD, and the substantial challenge of reintegrating into civilian society. While not all Veterans represent a vulnerable group, the experience is varied, and the needs for recovery are often complex.
Navigating the health care system is difficult, and it’s harder for people who are regularly displaced to schedule and keep traditional appointments.
We owe our thanks to our thousands of neighbors living in homelessness who offered us their time and their stories to make the ongoing work to find equitable housing for all possible. Thank you to our partners who served as interviewers. We also appreciate the cities that hosted interview locations, all the partners who made this possible, and the KCRHA staff who lead this project. We appreciate you.
2024 PIT One-Pager
2024 PIT Count FAQs
As more reports and information are released, we will add PDFs, graphics, and presentations here.
What is the Point-in-Time Count?
The Point-In-Time (PIT) count is a one-night estimate of both sheltered and unsheltered populations experiencing homelessness. Cities and counties nationwide conduct the count during the last week of January. The Department of Housing and Urban Development (HUD) requires the PIT count to be conducted every two years to receive federal funding.
How does this data compare to other estimates of homelessness in King County?
The Point-in-Time Count seeks to estimate the number of people who experience homelessness on a single night of the year. Over an entire year, KCRHA serves substantially more people, and the PIT count is broadly understood to be an undercount. As such, KCRHA also heavily relies on the Washington Department of Commerce’s estimate (derived from information in dozens of administrative databases ranging from unemployment insurance to Medicaid) that nearly 54,000 people experienced homelessness in King County over the course of a year.
How did you collect this information?
The KCRHA received approval from HUD to conduct the 2024 unsheltered count using a methodology called Respondent Driven Sampling (RDS). This methodology, consistent with the 2022 PIT Count, has a proven track record for reaching people who are not already connected to services. It provides a valuable data point that supplements client data in the Homeless Management Information System (HMIS) and other systems. RDS has been endorsed by numerous studies by academic researchers and the World Health Organization, confirming its effectiveness in producing high-quality demographic and population estimates.
The count took place from January 22 – February 2, 2024. KCRHA staff and more than 130 volunteers conducted interviews at 19 hub sites in urban, suburban, and rural parts of King County. People experiencing homelessness answered questions about their living situation and health and provided demographic information. Each person referred others in their network to a hub site for the same process. KCRHA worked with an expert statistician at the University of Washington to advise on sampling design and statistical modeling. We pulled the sheltered count from the Homelessness Management Information System (HMIS) data on January 25, 2024.
A video of Owen Kajfasz, KCRHA’s Chief Community Impact Officer, explaining the methodology is available on our YouTube channel.
How is RDS better than the traditional volunteer PIT Count?
The traditional unsheltered Point-In-Time count relied on volunteers to spread out across the county on one night in January and count the number of people that they physically see living unsheltered, multiplied by a number that’s meant to estimate the people they didn’t see (such as people in abandoned buildings). Because it relies on what volunteers see during a few hours in the early morning, in a neighborhood or area that may be unfamiliar to them, recorded on a paper tally sheet, at a time when there may be heavy rain or cold, there are many ways for data to be missed. Most people in the data science and homeless services sector agree that this traditional hand count results in an undercount, which may mask the full scale of the problem.
What’s the difference between sheltered and unsheltered?
Sheltered homelessness refers to people who are staying in emergency shelters, transitional housing programs, or safe havens. Unsheltered homelessness refers to people whose primary nighttime location is a public or private place not designated for or ordinarily used as a regular sleeping accommodation—for example, the streets, vehicles, or parks.
How did the 2024 numbers change compared to 2022?
The number of people experiencing homelessness overall in King County is 23% higher than our 2022 report. Here’s a breakdown.
| Year | Sheltered | Unsheltered | Total |
| 2022 | 5,683 | 7,685 | 13,368 |
| 2023 | 6,464 | N/A | |
| 2024 | 6,575 | 9,810 | 16,385 |
Youth and family homelessness is lower than in 2022 (see one-pager).
Why are the numbers higher?
This is a complex question. Homelessness is up across the country. We recommend reading the latest publication from the Federal Interagency Council on Homelessness to learn some key facts about homelessness in our country and some key strategies that are being applied in communities like King County.
Homelessness is a housing problem, and the lack of affordable options is impacting King County residents. A recent report from the Department of Commerce emphasized the lack of affordable housing options has reached critical levels: “Nearly half of the new homes required in the coming decades must be affordable to households earning less than 50% of area median family income. This shortage of affordable housing contributes to homelessness, housing instability, and increasing costs for low- and moderate-income families.” Also, while people are exiting homelessness, more people are entering homelessness.
KCRHA also expanded the number of hub sites and added sites in locations recommended by community feedback, leading to more completed surveys.
Were there substantial shifts in the demographics of people experiencing homelessness?
The results indicate a substantial increase in the share of people who report as White among people experiencing homelessness. Our more detailed report, which will be released this summer, will examine whether that change is a result of the following:
- The methodology for conducting the count.
- The impact of a change in how the Census Bureau dictates how we collect racial and ethnic identity.
- A fundamental shift in who is experiencing homelessness in King County.
- Or some other factor.
Were there changes in the number of people from groups or populations experiencing homelessness that are notable?
More detailed data and analysis will be released later.
How many people are experiencing homelessness in my area?
KCRHA will share a geographic breakdown of the count later.
Data Collection: January 22 – February 2, 2024
Analysis of Data: Feb 2 – April 30, 2024
- Unsheltered data is verified and cleaned
- Shelter and transitional program providers clean, review, and submit data
- Unsheltered and sheltered data is combined into one data set to be prepared for submission to HUD
- Final data is reviewed and approved by KCRHA leadership
- Final data set is submitted to HUD
Report Development: February 2 – May 31, 2024
- Volunteer feedback is collected via surveys and focus groups and is analyzed
- Final data set is analyzed and written into a report for the community
- Documents are prepared and posted for KCRHA boards and the general public
- Community feedback sessions on the PIT report results are scheduled
The final report will be available to the public by July 31, 2024, via the KCRHA website, and KCRHA will host a community forum for further discussion.
Download the 2024 Unsheltered PIT Count Methodology Info Sheet
Watch a video with details on the methodology
View a letter from University of Washington researchers about the methodology
What We Did
Prior to 2022, the unsheltered PIT was conducted by volunteers one night in January, using a census and survey. The PIT is widely understood to be an undercount, especially as it represents a single night rather than a full year.
The KCRHA received approval from HUD to conduct the 2024 unsheltered count using a methodology called Respondent Driven Sampling (RDS). This methodology is consistent with the 2022 PIT Count. RDS has been shown to be effective in reaching people who are not already connected to services, providing a data point that supplements client data in the Homeless Management Information System (HMIS) and other systems. This methodology has a strong track record for producing high-quality demographic and population estimates, confirmed by numerous studies by academic researchers and the World Health Organization.
KCRHA is working with researchers at the University of Washington and people with lived experience of homelessness to ensure validity in design, data collection, and analysis. We will work with these researchers to have the final methodology approved by an Institutional Review Board (IRB) and results will be peer reviewed for publication. Data will be collected using a digital survey and will not include qualitative interviews like the 2022 count.
For the 2024 unsheltered PIT, KCRHA gathered data from January 22 – February 2, 2024, and then worked with an expert statistician at the University of Washington to advise on sampling design and statistical modeling. The sheltered count was pulled from the Homelessness Management Information system (HMIS) data on January 25, 2024.
How This Works
- Start interviews at places like encampments and day centers across King County
- Ask people who were interviewed to connect us with other people who could be interviewed too
- People can then be interviewed at “hubs” hosted at places like libraries
- Those people are asked to connect us with more people they know
- Interviewees were compensated for their time with a $25 prepaid debit card and provided bus tickets to and from hubs.
- In addition to completing an interview, participants complete a demographic and network survey
- Our Research and Analytics Team used these surveys to produce population estimates for the unsheltered PIT